
Analysing website performance data, such as that from Google Analytics (GA) and Google Search Console (GSC) will help you optimise to generate leads faster by understanding user behaviour on your website.
In this guide, we’re going to focus on some top-level metrics that you can investigate, which will help you both complete your audit of your SaaS website and help you define your SEO strategy.
Here we’re going to focus on investigating website data via GA and GSC. Though, you can also investigate user behaviour via deeper level tracking tools such as HotJar and Microsoft Clarity.
Some of the most important areas you want to initially assess are as follows:
Google Search Console
GSC data tells you how your website is performing in search engines (Google in this case) and how searchers are interacting with your search results.
Analysing GSC data will help you draw conclusions about whether there’s opportunity to get more clicks. When you analyse GSC data, you will look into the following areas:
- Average Position
- CTR
- URL clicks
Google Analytics
Google Analytics data tells you how website visitors are interacting with your website. Analysing GA data allows you to draw conclusions about how to better optimise your site for increased conversions.
The items we’re going to discuss in this guide are:
- Average Engagement Time
- Events
- Conversions
Below, we talk about all the items from above, including: what they mean; how to find the info you need; and, how to interpret the data you find.
Average Position
Average Position metrics in Google Search Console tell you how well your website is performing for specific keywords or queries.
In other words, it provides insights into the visibility of the website in search results and its competitiveness compared to other websites targeting the same keywords.
When analysing the average position of keywords via GSC, it’s best to do so on a page by page basis. Trying to do the whole website once is both impractical and confusing.
How to find Average Position data
- In Google Search Console, go to the “Performance” section.
- Look at the graph displaying the Average Position for your website.
- To analyse the average position for specific queries or pages, scroll down to the “Queries” or “Pages” section below the graph.
- Click on the “Queries” or “Pages” tab to see a list of search queries or pages along with metrics such as Total Clicks, Total Impressions, Average CTR, and Average Position for each query or page.
What can you do with this info?
Average position data in Google Search Console (GSC) provides insights into the typical ranking position of your website’s pages in Google search results for specific queries. Here’s how you can leverage average position data in GSC:
- Keyword position trends: The first thing you should check is if keyword performance for a given page is generally improving or declining.
GSC allows you to view historic data, so looking at quarterly or even yearly data is a good idea. From here, you might decide to make a list of pages which are on a downward trend and need your attention. - Low-hanging fruits: As a backup to the keyword review you performed earlier, you can also find keywords hanging just outside of the top 10.
Doing this on a page-by-page basis for multiple pages, which provide you with a picture of content on your website should be prioritised for further optimisation efforts in order to drive results as quickly as possible. - New keyword opportunities: Those who have spent enough time in SEO will know that tools like Ahrefs and SEMRush don’t always provide you with a complete list of keywords that a particular page is ranking for.
By reviewing keyword data via GSC, you may find new ranking opportunities by complete accident. This could lead to improving existing content or creating new content altogether.
We recommend paying particular attention to this area, as you’d be surprised how often new keyword opportunities will arise.
From the reading above, you can see the value of evaluating keyword position data via GSC. You can begin by getting an overview of ranking trends and end up discovering completely new keywords without even trying.
CTR
After checking keyword position metrics, the logical next step would be to see the click through rate (CTR) for each page.
This metric tells you the percentage of users who click on a your search engine result compared to the total number of users who view it.
CTR metrics are important to analyse, as just ranking well isn’t enough. You want searchers to click on your result. In addition, more clicks on your results – instead of your competitors – typically results in higher rankings as well.
So, this isn’t an area you want to ignore.
How to find it CTR data
- In Google Search Console, navigate to the “Performance” section as described above.
- Look at the graph displaying the Average CTR (Click-Through Rate) for your website.
- To analyse CTR for specific queries or pages, scroll down to the “Queries” or “Pages” section below the graph.
- Click on the “Queries” tab to see a list of search queries along with metrics such as Total Clicks, Total Impressions, Average CTR, and Average Position for each query.
We recommend looking at CTR on a page-by-page basis.
What can you do with this info?
It’s important to first understand what influences click through rates. These are the items you should look out for.
- Keyword position
- Title tags
- Meta tags
- Rich features
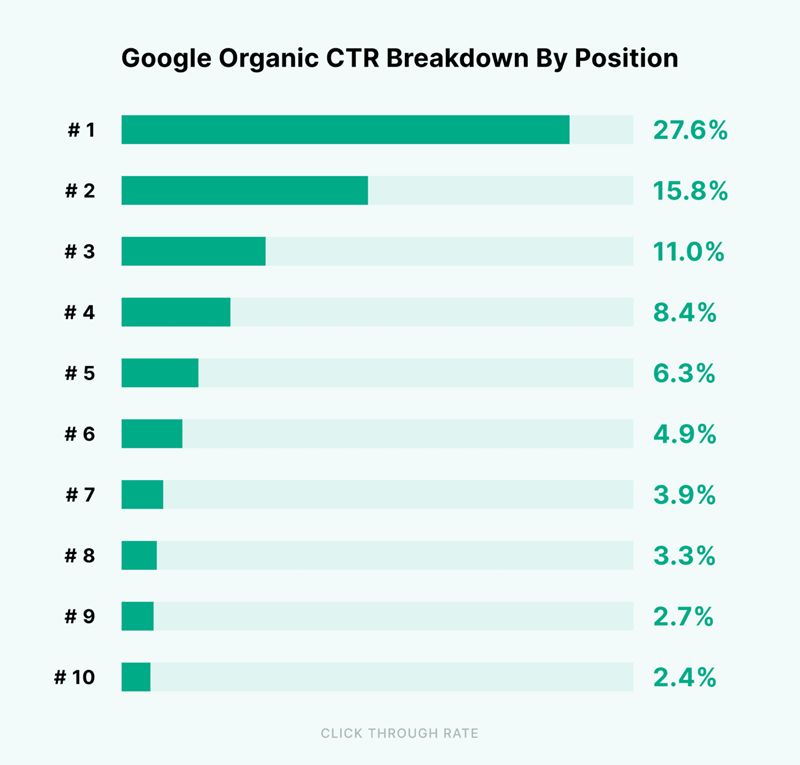
Next, what’s considered a good click through rate for organic search results? This is a whole topic all on its own, and there’s no real answer. The image below though, does provide a bit of a guide.
Now let’s get into what you can actually do with the CTR data you’re looking at.
Check alignment with keyword positioning
So first off, you can see how well your CTR aligns with the average position of the most important keywords that you’re targeting for any given page.
If you’re doing well i.e., approximately as well as in the graph above or better, then there’s not much to look into. On the other hand, if you’re performing poorly then you may want to look in the next two-most immediate items that affect CTR.
Inspect title tags
Firstly, the title tag. This is the first thing that any user notices when they see your result in search engines. They also have to read it in order to decide whether a search result is relevant to their query.
If you find that your average CTR for a given page and keywords isn’t quite as good as it should be, look into whether you could create a more engaging title tag.
Inspect meta tags
Next up, you should check out your meta description. It provides a more detailed description of what a searcher can expect to find on a page after they’ve clicked the search result.
Inspect your title tag to see if it’s providing a high-quality description of the page it’s talking about.
Check for rich snippets
In plain English, these are enhanced search results, which are more visually appealing to searchers. BacklinkKO has written a whole guide on them.
What’s important to you though is, pages with rich snippets are more likely to enjoy a better CTR. Therefore, inspect which pages have rich snippets and what kind.
If you can’t find any then you can definitely create a list of pages that you should optimise for rich snippets.
URL Clicks
The number of times that users click on a specific URL, typically from search engine results pages (SERPs) or other websites.
Tracking URL clicks can help measure the effectiveness of SEO efforts in driving traffic to a website.
How to find URL Clicks data
- Sign in to your Google Search Console account and select the property (website) you want to analyze.
- In the left-hand menu, click on “Performance.”
- You’ll see a graph displaying the Total Clicks, Total Impressions, Average CTR, and Average Position for your website.
- To analyze URL clicks for specific pages, scroll down to the “Queries” or “Pages” section below the graph.
- Click on the “Pages” tab to see a list of your website’s pages along with metrics such as Total Clicks, Total Impressions, Average CTR, and Average Position for each page.
What can you do with this info?
As we’ve mentioned before, GSC gives you access to historic data, and even allows you to draw comparisons between current and past data.
For example, you may want to compare click data for the year that’s just past and the previous year. Or you may want to compare Q1 of 2024 and Q1 of 2023.
GSC will allow you to do that. Once you’ve pulled the data, here are some items you may want to see.
URL Click Trends
The most immediate item you want to check is whether clicks are going up or down i.e., have website clicks been increasing/decreasing?
You can do this both sitewide and for individual pages thanks to the filters that Google Search Console offers
Check for seasonality
Some businesses are affected by seasonality. For example, if you’re a SaaS software targeting schools, you may experience less traffic during the school holidays.
By comparing two years worth of data, you will be able to identify periods of lower traffic and avoid panic when it happens in the future.
Too often, website managers think they’ve been penalised as soon as website visitors are declining.
Find out how Users are Behaving on Your Website
Contact us for a Data and Analytics Assessment
Average Engagement Time
This refers to the amount of time that visitors spend on a particular web page before navigating away. It is an indication of how engaging and valuable the content is to users.
In SEO, longer time spent on a page can signal to search engines that the content is relevant and useful.
How to find Average Engagement Time data
- Navigate to the “Reports” section and click on “Examine User Behaviour” in the left-hand menu.
- Next, click “Pages and Screens”
- Here, you’ll find metrics like Average Engagement Time per Session, Views Per User, and Event Count and Conversions.
- By analyzing these metrics alongside the number of page views, you can estimate the average time users spend on your pages.
What can you do with this info?
Average engagement time data in Google Analytics 4 (GA4) provides insights into how much time users spend actively engaging with your website content.
You can leverage this data to identify high-quality content i.e., content which the user spend more time interacting with.
From there, you could analyse high performing content pieces in order to determine why they’re performing so well and what techniques you can apply to other, similar content pieces.
Events
These are specific interactions that users have with pages on your website, such as clicks on links, video plays, scrolling more than 50% of a page, and more.
Tracking events can provide insights into user behaviour and engagement with your website content. This is a step up from just seeing which pages website visitors are spending more time on.
How to find Events data
- In GA4, events are tracked using the Event parameters.
- Go to the “Reports” > “Examine User Behaviour” > “Events” in the left-hand menu.
- You’ll see a list of events that have been tracked on your website, along with metrics such as Event Count, Unique Events, and Event Value.
- You can explore events by category, action, label, or other parameters to analyze user interactions with your website.
What can you do with this info?
Events data in Google Analytics can provide valuable insights for SEO purposes, allowing you to understand how users interact with your website beyond how long visitors are hanging around for.
Here’s how you can utilise events data for SEO analysis:
User Engagement Analysis:
Events data can help you understand how users engage with your website content.
For example, you can check to see:
- Which pages website visitors most often scroll to the end
- On which pages do website visitors most often engage with multimedia e.g. videos
- Which pages users most often click on the “Contact Us” button
There are many more metrics you can look into.
Analysing these sorts of elements will tell you just how website visitors are interacting with your website and what the quality of those interactions is.
From there, you can identify specific content types in which you should invest more resources as part of your SEO efforts.
Conversions
These are the desired actions that a user takes on a website, such as signing up for a free trial of your software, requesting a demo, downloading a lead magnet, subscribing to your newsletter or filling out a contact form. Plus more.
In SEO, conversions are often tracked to measure the effectiveness of website traffic in achieving business goals.
How to find Conversions data
- Go to your GA4 property and navigate to the “Reports” section.
- In the left-hand menu, click on “Conversions” > Examine User Behavior > Conversions
- Here, you’ll find a variety of conversion-related metrics such as Total Conversions, Conversion Rate, and specific conversion events you’ve set up (e.g., purchases, form submissions).
- You can further explore conversions by segments, date ranges, and other dimensions to understand their performance.
What can you do with this info?
The first thing you can do is see if you have any conversions defined on your website. If not, then you need to work on defining some.
Once you have some defined conversions, you can see how each is performing and trending.
Here are some specific areas that you can look into.
Identify Top Performing Pages
Look into which conversions deliver the most conversions. Remember, you’re going to define different conversion types.
So, it’s important to keep in mind.So you don’t want to make the mistake of taking a blanket approach and seeing which page delivers the most conversions overall.
Instead, first choose a conversion that you want to check the performance of e.g. demo request. Then, identify which pages deliver the most demo request conversions.
Repeat for each conversion type that you would like to review. This will help you identify which types of content result in a particular type of conversion occurring more often.
You will now have an understanding of the content and conversion types that you should associate with each other.
Keyword Analysis
Analyse the keywords that are driving conversions to your website. Like above, you will be able to make a correlation between keywords and conversions.
Again, it’s important to not take a blanket approach. First take a conversion that you want to assess, and look into keywords which most often cause that conversion to take place.
For example, you may find that short-tail keywords (often covered by articles) lead to more lead magnet downloads (e.g., checklists).
In such a scenario, you could decide to place more checklists through informative guides/articles on your website – in order to turn regular website visitors into leads.
User Behaviour Analysis
Dive into user behaviour data to understand how users are interacting with your website before converting.
A key area you could look into here are user engagement metrics, telling you how long someone is spending on your page. Naturally, the longer they spend on your page, the more engaged they are.
If, for example, you find that some of your pages have very low engagement times then you can investigate why that’s the case.
Another way in which you can analyse user behaviour is to look into navigation paths i.e., the pages that website visitors click on after they land on your website and before they convert.
This will give you an understanding of how to sequence content on your website in order to drive more conversions.
Re-cap: Analysing top-level data allows you to optimise for conversions faster
GSC data tells you how searchers are behaving before they arrive on your website. Google Analytics data tell you how those same people are behaving once they get to your site.
Analysing GSC and Google Analytics data together will provide you with insight on how to attract more website visitors and how to push more visitors further along your sales funnel, turning them into paying customers.